
The problem: scale, noise, and 3 AM alerts
Running a classifieds marketplace at OLX India’s scale means roughly 150 microservices, tens of billions of log lines flowing through a centralized ClickHouse cluster, and a user base spanning the country. Ad listings, buyer-seller chat, payments, content moderation, search, and notifications are all wired together through an event-driven backbone — and when something breaks in that web of dependencies, incidents don’t wait for business hours.
Before automation, figuring out what broke and why looked like this every time:
- An on-call engineer gets paged by PagerDuty at 3 AM.
- They pivot between New Relic dashboards, ClickHouse log queries, and Slack threads.
- 30–60 minutes go by just understanding the blast radius — before a single line of mitigation gets written.
That investigation time was a silent tax on our MTTR (Mean Time to Resolution), and it was eating into engineers’ sleep and focus. So we asked: can we automate the “what happened and why” part of incident response?
We now believe the answer is yes — but we got there in two attempts, not one.
Round one: IntelliOps, our in-house attempt
“The best way to appreciate a managed service is to build the unmanaged version yourself first.”
Before AWS DevOps Agent existed in our toolbox, we built IntelliOps: an internal AI-powered RCA assistant, fully self-hosted.
The stack:
- UI: LibreChat, an open-source chat interface
- Model: AWS Bedrock running
gpt-oss-120b, billed per token - Storage: MongoDB, for chat history and token accounting
- Data sources: ClickHouse MCP (logs), New Relic MCP (APM metrics and traces), Kubernetes MCP (cluster state) — the same three we still use today.
- Trigger: A Slack listener watching for alert messages matching
Incident #<ID>:in the title. On a match, it extracted the incident ID and service name and kicked off an investigation automatically.
It worked, and for a while it was genuinely useful — structured RCA responses appeared in the channel shortly after an alert fired, built from real log and metrics data. But running our own model at scale surfaced real problems:
- Model cost was ours to own. A complex, multi-service incident — exactly the kind that needs AI assistance most — burns through a lot of tokens across multiple investigation turns. Costs were manageable but unpredictable, scaling directly with incident volume.
- Context deadline exceeded — the silent-truncation problem. On cascading, multi-service incidents,
gpt-oss-120bwould hit its context window limit. Output came back truncated, often with no clear signal that the analysis was incomplete. Half an RCA that looks like a whole one is arguably worse than no RCA. - Full maintenance burden. LibreChat upgrades, MongoDB operations, MCP server deployments, Bedrock credential rotation — every component was one more thing that could break at 3 AM.
- A single, fragile trigger path. IntelliOps only investigated incidents posted to one specific Slack channel, in one specific message format. If Slack was slow or the format drifted, nothing fired.
- No de-duplication. One infrastructure event cascading into ten downstream alerts meant ten separate analyses flooding the channel.
- No AWS infrastructure visibility. IntelliOps could reason about logs, APM data, and Kubernetes state — but not about the AWS resources underneath them. Giving it visibility into EC2, RDS, ElastiCache, OpenSearch, and the rest would have meant hand-building and maintaining a separate MCP server per AWS service, which we never got to.
IntelliOps Architecture:
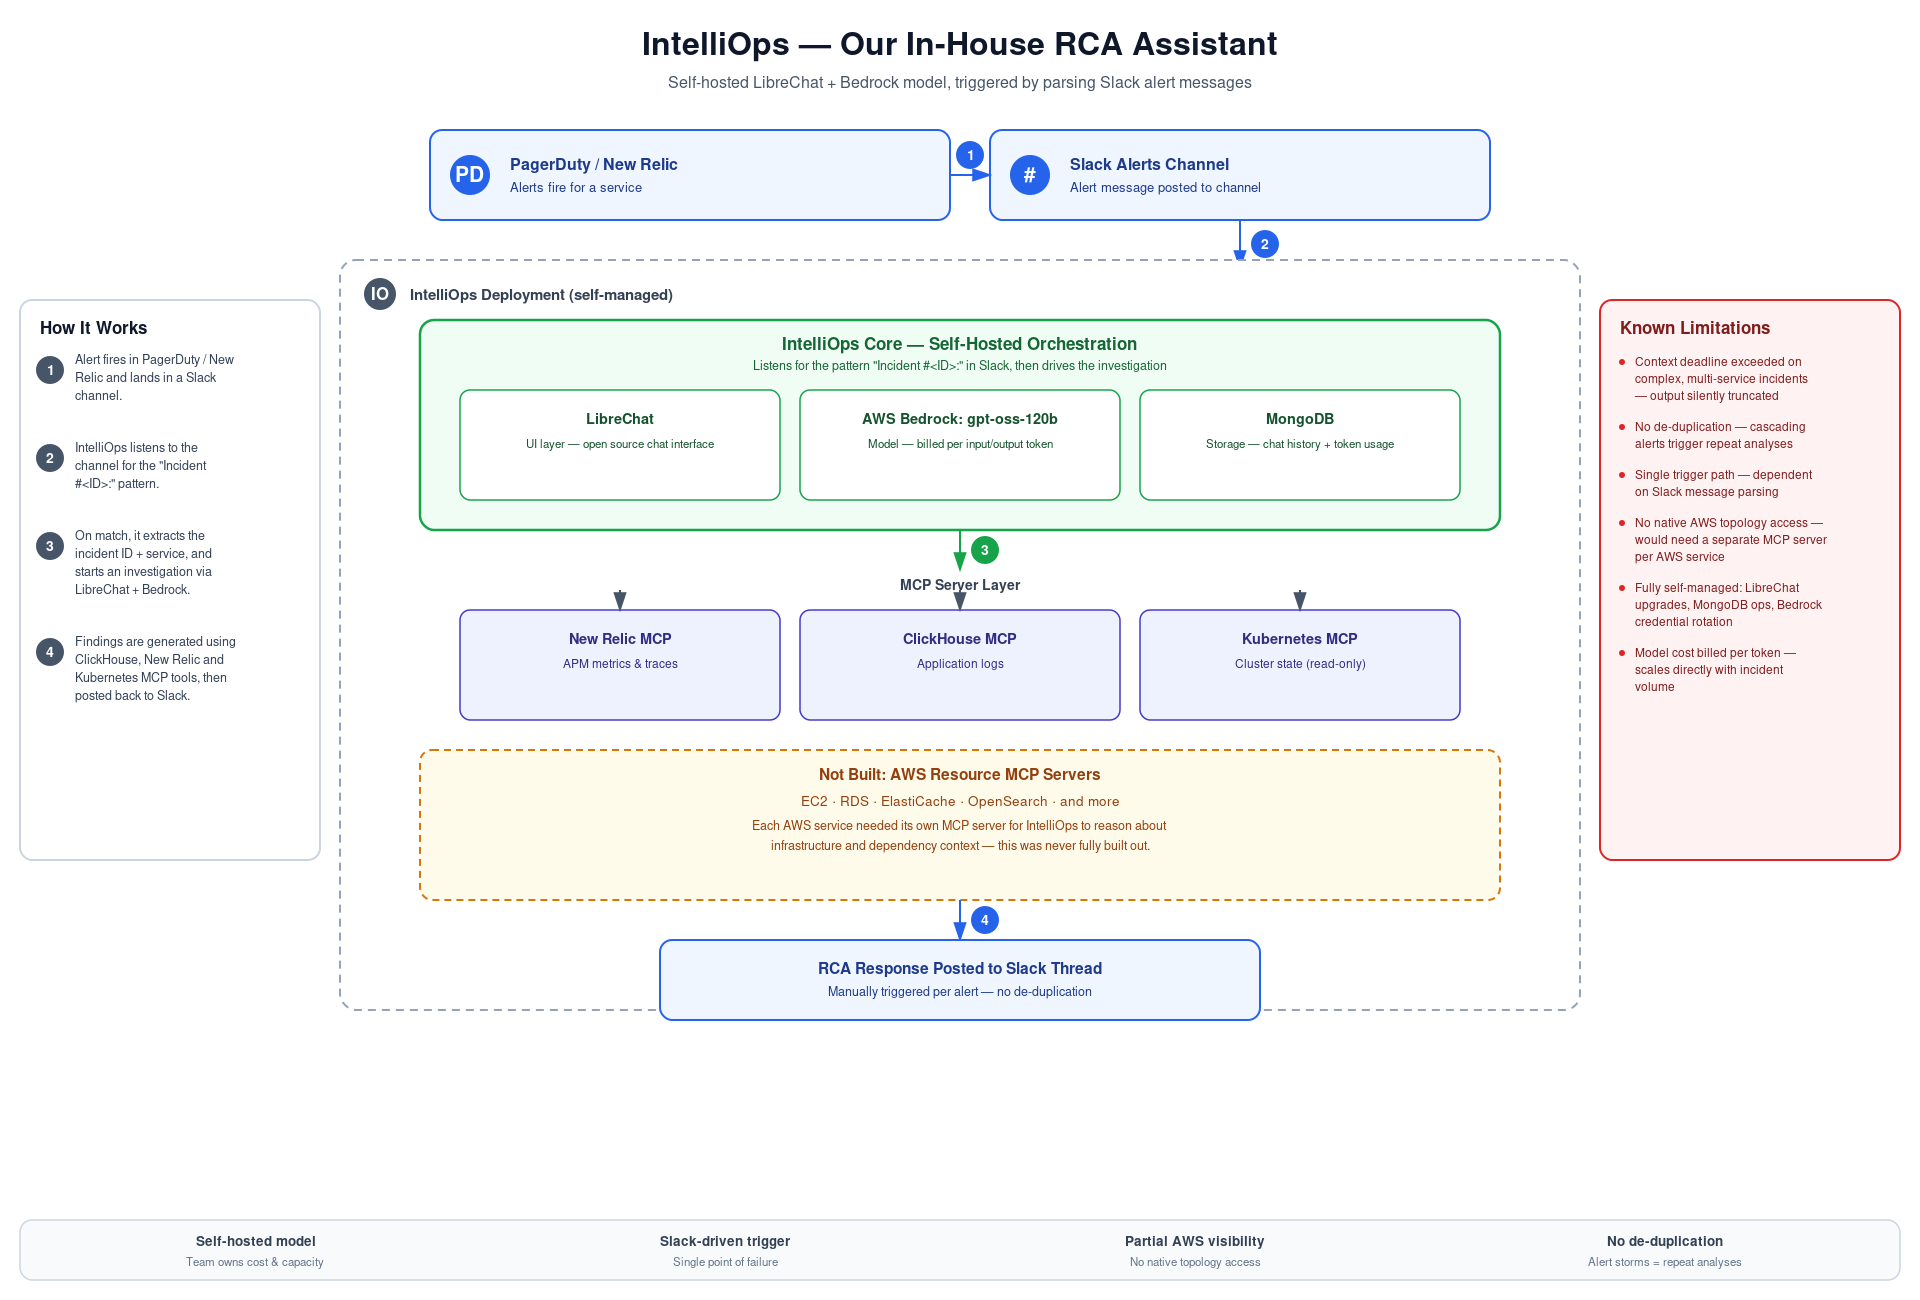
IntelliOps wasn’t a failed project — it was a proof of concept that validated the whole approach. It just made clear that the orchestration layer needed to be somebody else’s problem.
Round two: AWS DevOps Agent
AWS DevOps Agent is a fully managed AI agent for engineering operations. It connects to your observability stack, listens for signals, and autonomously investigates incidents — querying metrics, scanning logs, correlating traces, and generating structured RCA reports with mitigation recommendations. Think of it as a Level 2 on-call engineer who never sleeps and already knows every tool in the stack.
We didn’t evaluate it in the abstract — we evaluated it against every pain point IntelliOps had already taught us:
- Native AWS integration. Our infrastructure already lives in AWS. A read-only IAM role gives the agent visibility into the account topology — EC2, RDS, ElastiCache, OpenSearch, and more — without us building a single extra MCP server.
- Native Kubernetes access, the same way. Rather than a separate kubeconfig or credential to manage, we granted the agent’s IAM role read-only cluster access through an EKS access entry — the same IAM-first pattern as the AWS account access above, mapped straight to a read-only Kubernetes RBAC policy.
- The same MCP layer, reused. ClickHouse and New Relic MCP servers we’d already built for IntelliOps plugged straight in as data sources. Nothing was thrown away.
- Direct, webhook-driven triggering. No Slack-parsing middleman — PagerDuty posts straight to the agent’s webhook.
- Slack-native output for triggered incidents, plus a UI for everything else. Automated investigations land in Slack, where the team already works during incidents — but engineers can also open the DevOps Agent UI directly for day-to-day investigation: ad hoc questions, exploratory debugging, or anything that isn’t a live page.
- A persistent incident knowledge base, not a one-off chat session — past investigations inform future ones, whether they were triggered from PagerDuty or ad-hoc investigations from users via UI.
- One unified RCA skill file, so every investigation follows the same evidence-gathering method regardless of who (or what) triggered it.
- Built-in de-duplication, grouping cascading alerts into a single “LINKED” investigation instead of spamming the channel.
- Fully managed. No LibreChat, no MongoDB, no Bedrock credential rotation, no per-token cost to plan around.
AWS DevOps Agent architecture:
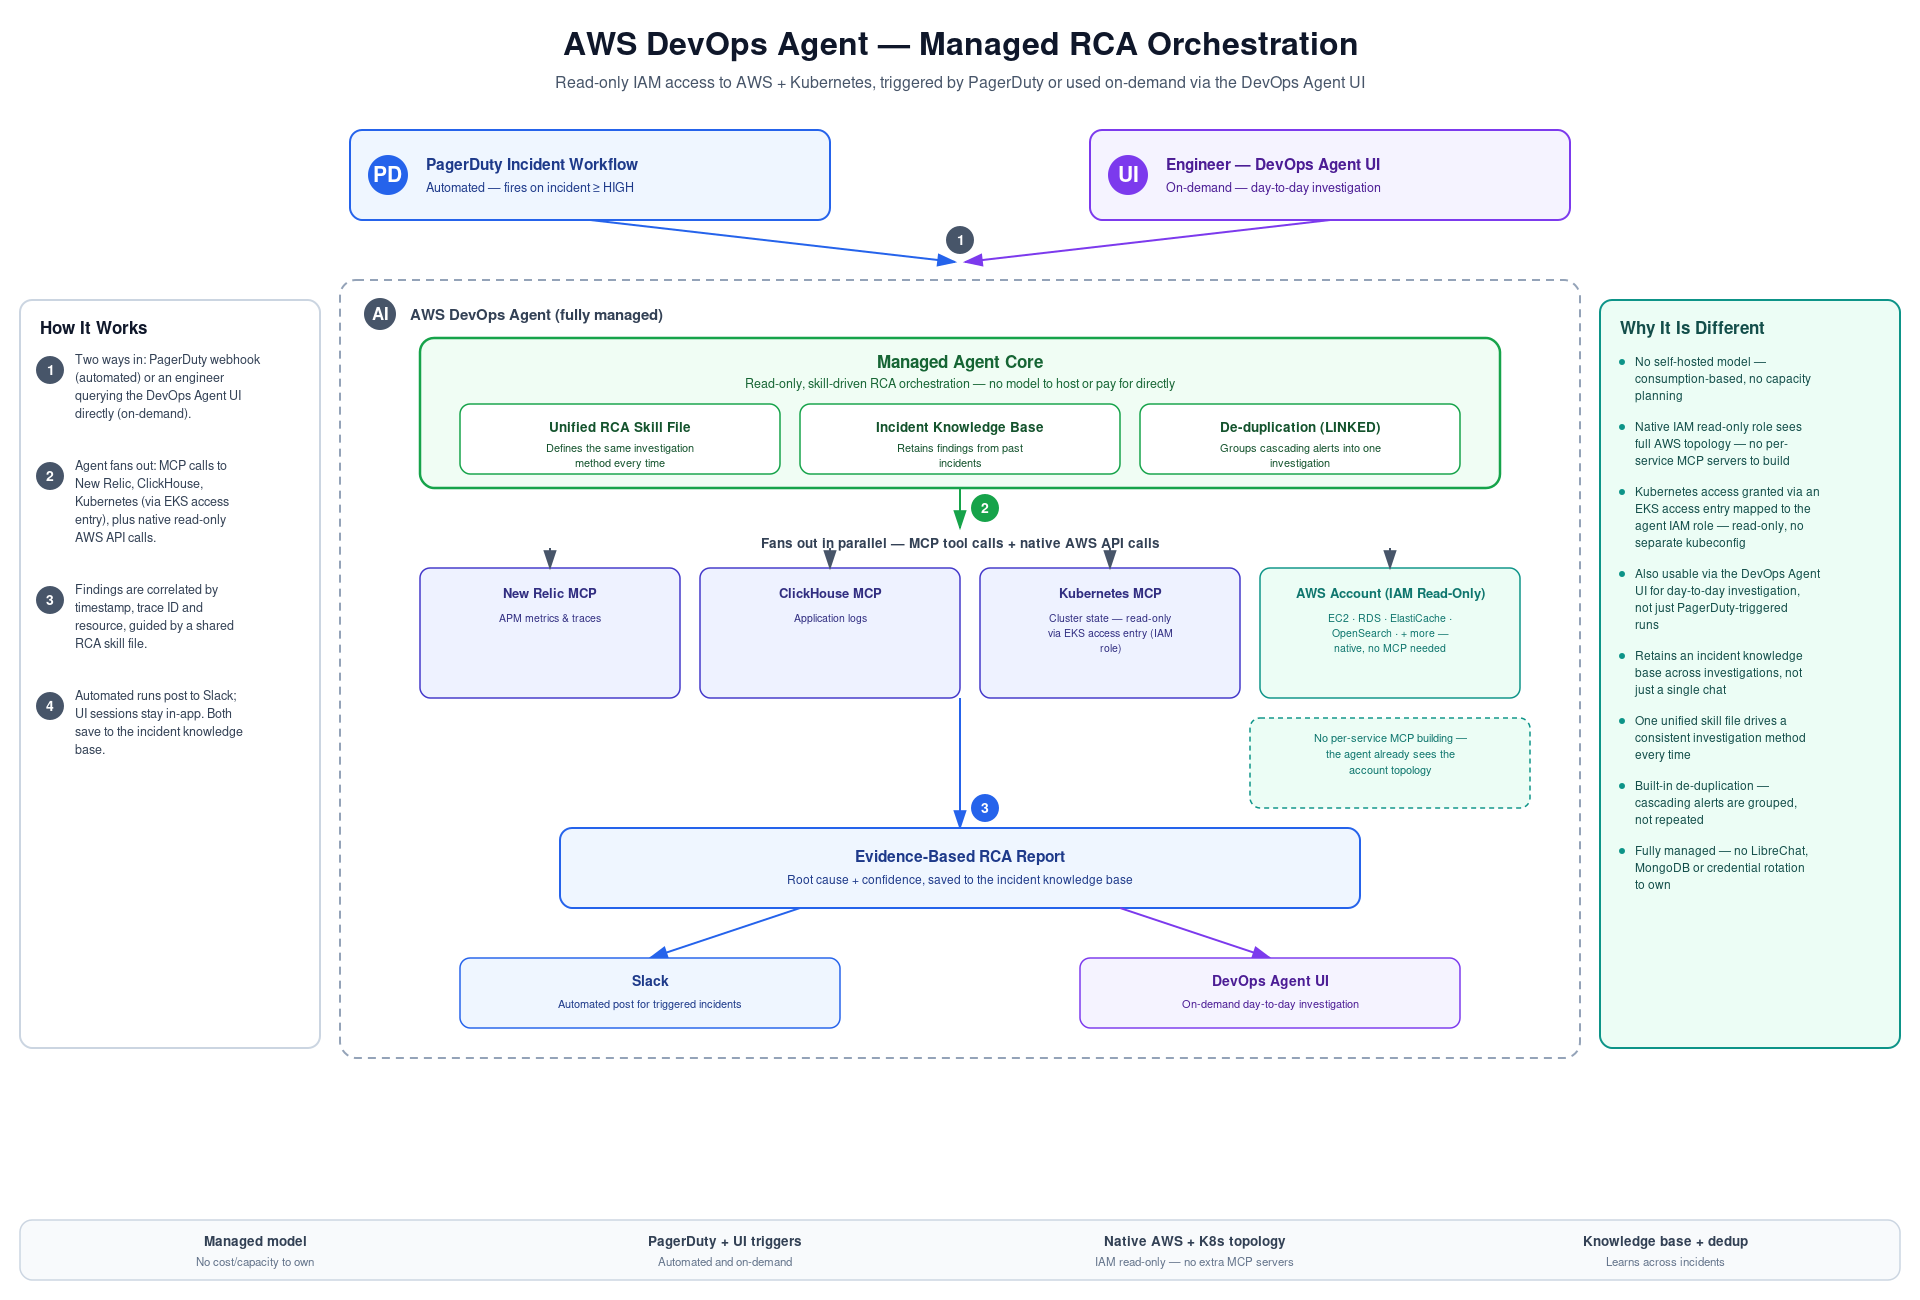
IntelliOps vs. AWS DevOps Agent
| Dimension | IntelliOps (in-house) | AWS DevOps Agent |
|---|---|---|
| UI | LibreChat (self-hosted) | Slack for automated output, plus a dedicated DevOps Agent UI for day-to-day, on-demand investigation |
| Model | gpt-oss-120b on Bedrock — billed per token | Managed — no model to select, host, or pay for directly |
| Storage | MongoDB (self-managed) | Managed |
| Trigger | Slack listener parsing an Incident #<ID>: pattern | Direct PagerDuty Incident Workflow webhook, or an engineer querying the UI directly |
| Observability data sources | ClickHouse + New Relic + Kubernetes (self-built MCP servers) | Same three MCP servers, reused as-is |
| Kubernetes access | Kubernetes MCP server, credentialed separately | Same Kubernetes MCP, authorized via an EKS access entry mapped to the agent’s IAM role — read-only, no separate kubeconfig |
| AWS infrastructure visibility | Would need a hand-built MCP server per AWS service (EC2, RDS, ElastiCache, OpenSearch, …) — never fully built | Native read-only IAM role sees the full AWS account topology out of the box |
| Incident memory | None beyond a raw MongoDB chat log | Persistent incident knowledge base, reused across future investigations |
| Investigation method | Ad hoc, per session | One unified RCA skill file — same method every time |
| De-duplication | None — cascading alerts trigger repeat analyses | Built-in (LINKED investigations — roughly a quarter of investigations de-duplicated in a recent month) |
| Maintenance | Fully self-managed (LibreChat, MongoDB, MCP servers, Bedrock credentials) | Fully managed |
The data-source row is identical on purpose — the MCP layer built for IntelliOps carried over directly. This was an orchestration swap, not a data migration.
How the pieces connect
Two ways in. For live incidents, PagerDuty is the automated trigger — Incident Workflows let us define automation that fires across all ~150 services from a single rule, no per-service webhook to maintain. We initially also wired New Relic as a second trigger path, but its default Kubernetes alerting policy generated continuous noise (default critical CPU and memory alerts) that flooded Slack with repetitive de-duplicated investigations. We disabled it as a trigger and kept it purely as a data source. Outside of live incidents, engineers can also open the DevOps Agent UI directly and ask it to investigate something — a suspicious metric, a one-off error spike, anything that doesn’t warrant a page. Same agent, same data sources, same skill file — just a different entry point for day-to-day debugging rather than 3 AM firefighting.
Data gathering. Once triggered — by PagerDuty or a person — the agent fans out in parallel:
- New Relic MCP — APM metrics, error rates, latency percentiles, distributed traces, and Kubernetes infrastructure samples (HPA/PDB state).
- ClickHouse MCP — full-text and structured search over centralized application logs, filtered to
ERROR/FATALseverity within the incident window. - Kubernetes (read-only) — deployments, pods, ReplicaSets, HPA, PDB, rollout history, and cluster events. Access is granted through an EKS access entry that maps the agent’s IAM role to a read-only Kubernetes RBAC policy — no separate kubeconfig or long-lived credential to rotate.
- Native AWS access (IAM read-only) — the account topology itself, without a dedicated MCP server per service.
Correlation. Trace IDs from New Relic are matched against ClickHouse log entries; pod events are cross-referenced against the incident timeline; the result is synthesized into a report with a root cause, a confidence level, and remediation suggestions — no auto-apply. Automated investigations post the report to Slack; UI-initiated ones stay in the conversation — either way, findings are saved to the shared incident knowledge base.
A simplified example of the kind of log query the agent runs during an investigation:
-- Illustrative pattern, not the production schema
SELECT timestamp, severity, message, trace_id
FROM logs_db.application_logs_dist
WHERE service_name = 'chat-service'
  AND severity IN ('ERROR', 'FATAL')
  AND timestamp BETWEEN :window_start AND :window_end
ORDER BY timestamp DESC
LIMIT 500
And the webhook payload shape PagerDuty sends to trigger an investigation:
{
  "eventType": "incident",
  "incidentId": "INC-7F3K2Q",
  "action": "triggered",
  "priority": "CRITICAL",
  "title": "<incident title>",
  "timestamp": "2026-08-07T02:15:00Z",
  "service": "chat-service"
}
Note: Two schema quirks are worth flagging if you’re building this yourself: priority must be uppercase (CRITICAL, HIGH, MEDIUM, LOW, MINIMAL) even though PagerDuty’s native urgency values are lowercase, and the field is required — a payload missing it gets acknowledged (HTTP 200) but silently triggers nothing.
A real incident, walked through
Scenario: Error rate spike on a production chat service.
| Time | What happens |
|---|---|
| T+0:00 | New Relic alert fires: error rate > 1% for 5 minutes |
| T+0:00 | PagerDuty incident created (CRITICAL), Incident Workflow fires |
| T+0:00 | Webhook POSTed to AWS DevOps Agent |
| T+0:01 | Agent queries New Relic for APM metrics, error traces, throughput |
| T+0:01 | Agent queries ClickHouse for ERROR/FATAL logs in the incident window |
| T+0:01 | Agent checks Kubernetes: pod restarts, ReplicaSet events, HPA state |
| T+0:02 | Trace IDs from New Relic matched against ClickHouse log entries; pod events cross-referenced with the error timeline |
| T+0:03 | Root cause identified (e.g., an upstream consumer lag causing a message-processing backlog), with a confidence level |
| T+0:03 | Mitigation plan drafted and RCA posted to Slack |
| T+0:04 | On-call engineer reads a structured report and starts mitigation |
Alert to actionable RCA: roughly 3–5 minutes. Previously: 30–45 minutes of manual investigation.
Results
| Metric | Before | After |
|---|---|---|
| Alert-to-RCA time | 30–45 min | 3–5 min |
| On-call investigation effort | High — manual pivoting across tools | Low — review an AI-generated report |
| Incidents requiring manual log diving | Nearly all | Significantly reduced |
| Coverage | Per-service setup needed | All services, via one PagerDuty workflow |
Beyond the numbers: Engineers get a starting hypothesis instead of a blank canvas, every investigation follows the same methodology regardless of who’s on call, and RCA reports build a searchable incident history new team members can learn from. We’re still collecting a full quarter of production data before publishing hard MTTR deltas fleet-wide — the numbers above reflect the shift we’ve observed so far.
Challenges we hit along the way
| # | Challenge | What went wrong | How we fixed it |
|---|---|---|---|
| 1 | PagerDuty webhooks are scoped per service | With ~150 services, per-service webhook config doesn’t scale | Used PagerDuty Incident Workflows — one rule, filtered by priority, covers every service |
| 2 | Auth mismatch | Webhook was set up with HMAC signing; the agent endpoint expects Bearer token auth | Regenerated the webhook using API-key (Bearer token) auth |
| 3 | Priority case mismatch | PagerDuty urgency is lowercase (high); the agent schema requires uppercase (HIGH) — mismatched requests failed silently | Mapped urgency to uppercase inside the workflow’s webhook payload template |
| 4 | Missing required field | priority wasn’t obviously required; omitting it returned HTTP 200 with no investigation triggered | Always send the complete payload; test integrations with the minimal required fields first |
| 5 | Second trigger path = noise | Running New Relic as a second trigger alongside PagerDuty meant routine Kubernetes events also fired investigations | Disabled New Relic as a trigger, kept it as a data source — PagerDuty’s human-curated relevance filter is now the only gate |
The meta-lesson across all five: more trigger sources isn’t more coverage — it’s more noise. Let your incident-management tool do the curation; that’s already where humans decided what’s worth waking someone up for.
Conclusion
Automating incident RCA compounds over time: every incident that gets auto-investigated is an engineer who sleeps through the night or stays focused on their sprint instead of pivoting between five tabs at 3 AM.
We built IntelliOps first, and that wasn’t wasted effort — it proved the MCP-based approach and told us exactly what a real solution needed: automated triggering, context headroom for complex incidents, de-duplication, native infrastructure visibility, and zero maintenance overhead. AWS DevOps Agent checked every box, and the MCP data layer we’d already built — ClickHouse, New Relic, Kubernetes — carried forward directly. We promoted the data layer and swapped the orchestration.
The integrations weren’t perfectly smooth out of the box — auth mismatches, case-sensitivity bugs, and alert noise are all real — but every one was solvable, and we’ve documented them here so you don’t have to rediscover them. If your on-call rotation is drowning in manual investigation toil, this is worth the investment: setup is measured in hours, the return in MTTR and on-call sanity.
Build the systems that do the boring work. Keep the humans for the interesting problems.
