“Your team just deployed a new microservice. Everything looks good , but two hours later, a user pings you on Slack: ‘Hey, service is down!’ Sound familiar?”
At OLX, reliability is at the heart of how we serve our users. Every downtime, no matter how small, directly impacts customer trust and business outcomes. While we had robust monitoring in place for our external-facing services, we realised that our internal services lacked visibility.
[TL;DR] This blog covers our journey of exploring different solutions, why we chose Uptime-Kuma, how we set it up, and the impact it has brought to our engineering teams.
The Problem We Faced
Internally, we run a variety of services — from APIs to worker processes — that are critical for our platform’s functionality. While we already have a robust monitoring stack for our production systems, we realized there was still a gap when it came to monitoring service health and availability at a more lightweight level.
The challenges were:
- No simple visibility into whether an internal service was up or down.
- Engineers often relied on manual checks or ad-hoc Slack messages to confirm service health.
- Our existing monitoring solutions, though powerful, were often too complex or heavyweight for this specific use case.
This pushed us to explore a solution that was easy to set up, lightweight, and cost-effective — while still giving teams the confidence to detect issues early.
Our Need
Our goal was clear:
- A lightweight, self-service tool for engineers.
- Ability to monitor internal services securely.
- Real-time alerts integrated with Slack.
- Open-source or cost-effective for long-term scalability.
Exploring Solutions
With this gap in mind, we started evaluating different options that could give us quick, reliable insights into service uptime and health checks without adding unnecessary operational overhead.
We looked at both SaaS-based tools and open-source solutions:
Evaluating the Options
Here’s how different tools stacked up against our needs:
| Tool | Type | Pros | Cons |
|---|---|---|---|
| Pingdom | SaaS | Reliable, easy to set up, good for public endpoints | Costly at scale, not suitable for internal services |
| Uptime Robot | SaaS | Simple UI, easy monitoring | Limited internal service monitoring, less customizable |
| Grafana + Prometheus | Open-source | Powerful metrics & visualization, widely adopted | Higher operational overhead for simple uptime checks |
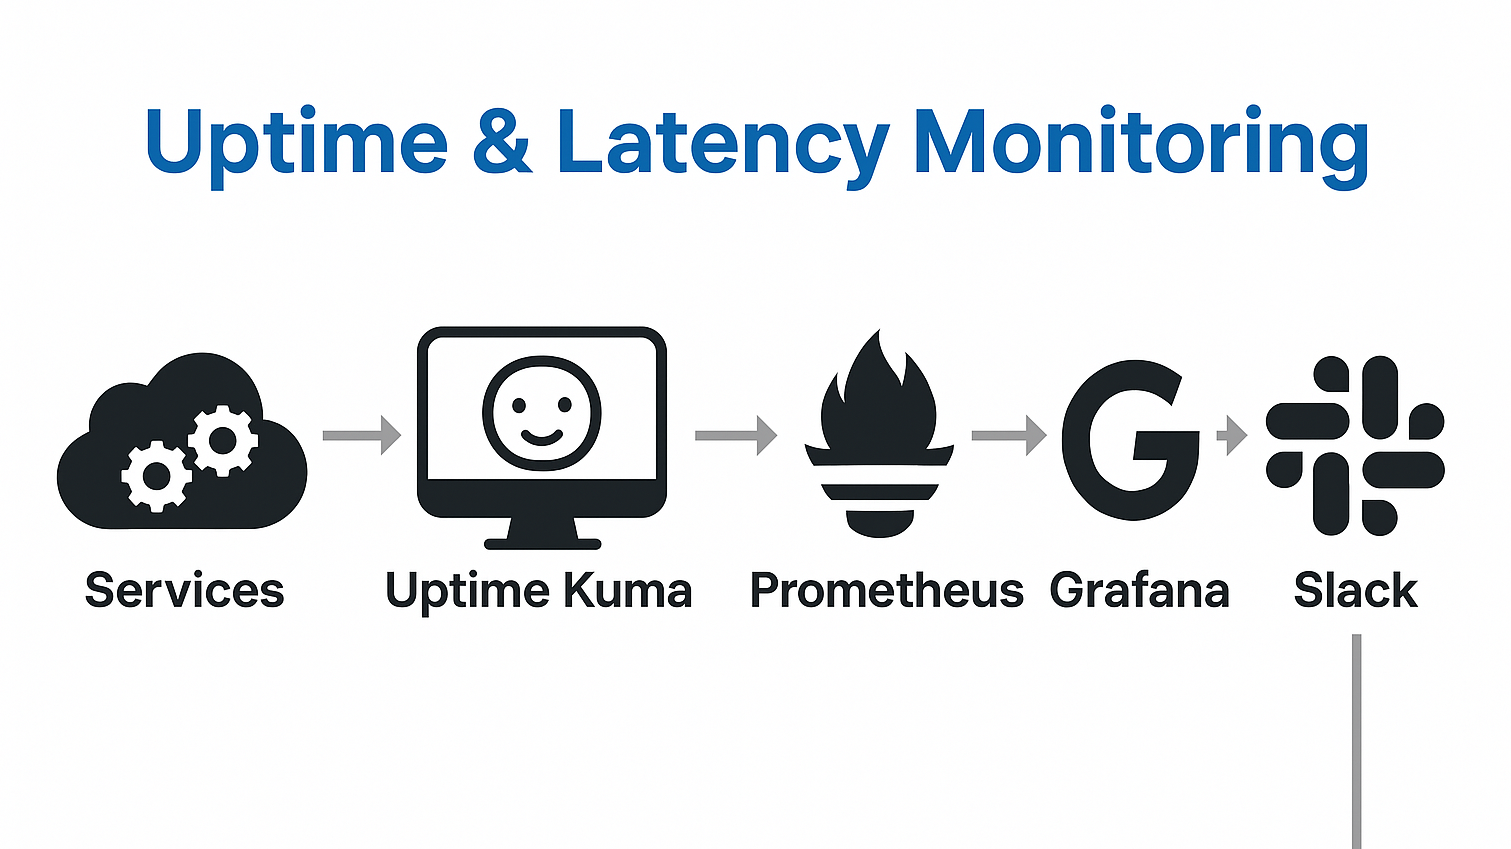
| Uptime Kuma | Open-source | Lightweight, self-hosted, Slack alerts, Prometheus integration | Newer project, fewer enterprise add-ons compared to big tools |
This exploration eventually led us to Uptime-Kuma.
Why We Chose Uptime-Kuma
After our evaluation, we found Uptime Kuma to be the best fit on our case. Uptime Kuma is an open-source, self-hosted monitoring tool that’s been gaining love in the DevOps and SRE community. Think of it as a friendly, lightweight alternative to SaaS tools like Pingdom.
It’s not meant to replace your full-blown observability stack, but it’s perfect for:
- Open-source & free – No licensing cost.
- Self-hosted – Full control of data and internal service monitoring.
- Easy setup – Can run in Docker with just a few lines.
- Flexible notifications – Native support for Slack, Telegram, PagerDuty, etc.
- Extensible – Prometheus integration for Grafana dashboards.
It struck the right balance between simplicity and capability.
Uptime-Kuma hits the sweet spot:
- 🛰️ Agentless Monitoring
Start monitoring without installing any agents on nodes- 🔌 Multi-Protocol Support
Supports HTTP(S), TCP, ICMP (ping), DNS, and more- 🔐 Self-Hosted Solution
Maintain full control over your data — ideal for privacy-focused setups- 💡 Open Source Advantage
Use Uptime Kuma completely free with no licensing costs- ⚙️ Customizable Monitoring
Set up multiple monitors with flexible intervals and response tracking
Getting Started in Minutes
Here’s how you can spin it up using Docker Compose:
Step 1: Docker Compose Setup: To Install Uptime-Kuma using Docker or Docker Compose you need to make sure these are installed prior to you continuing: https://github.com/louislam/uptime-kuma
version: "3.8"

services:
  uptime-kuma:
    image: louislam/uptime-kuma:2.0.0-beta.2
    container_name: uptime-kuma
    restart: always
    ports:
      - "3001:3001"  # This maps the container port "3001" to the host port "3001"
    volumes:
      - ~/uptime-kuma/data/:/app/data  # Configuring persistent storage
    environment:
      - TZ=IST  # Set the timezone (change to your preferred local timezone so monitoring times are the same)
      - UMASK=0022  # Set your file permissions manually
    networks:
      - kuma_network  # add your own custom network config
    healthcheck:
      test: ["CMD", "curl", "-f", "http://localhost:3001"]
      interval: 30s
      retries: 3
      start_period: 10s
      timeout: 5s
    logging:
      driver: "json-file"
      options:
        max-size: "10m"
        max-file: "3"

networks:
  kuma_network:
    driver: bridge
Run it:
docker-compose up -d
Now head to http://localhost:3001, create an account, and you’re ready to add your first monitor.
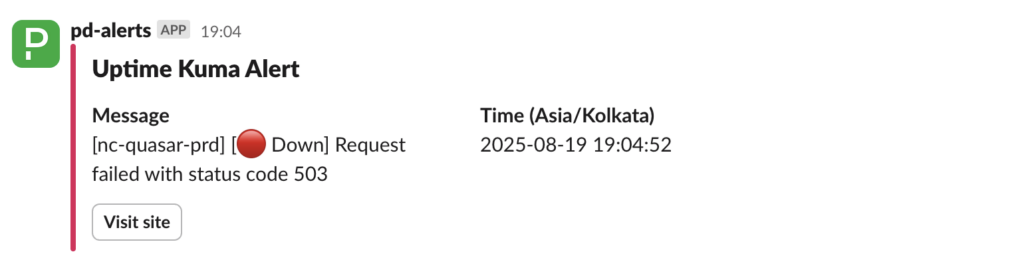
Example: monitor an API endpoint with a 30s interval. If it fails, get notified in Slack instantly.
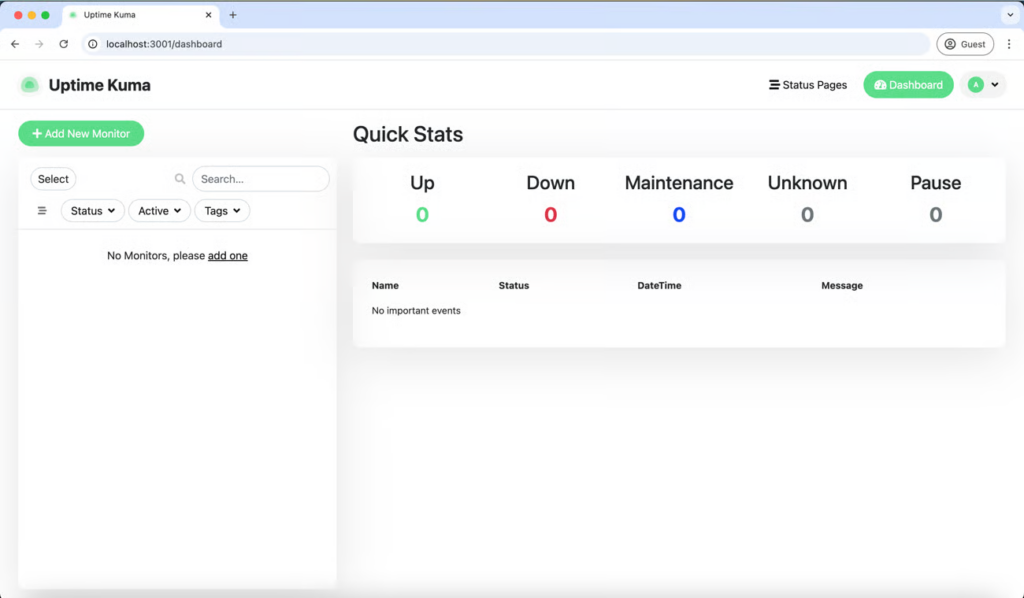
Step 2: Add Monitors
From the dashboard, we added monitors for:
- Internal APIs
- Databases
- Authentication endpoints
- Worker processes
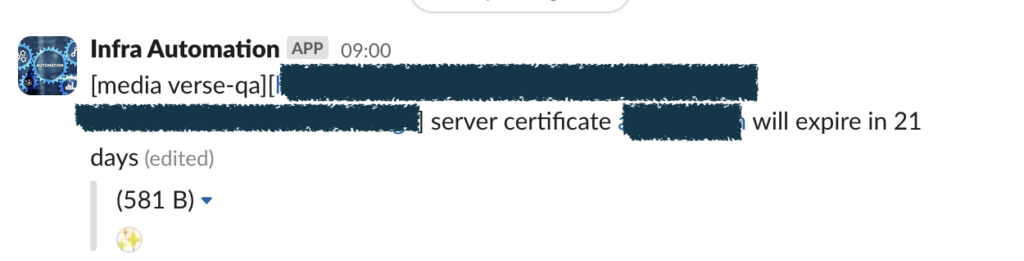
Each monitor tracks uptime, latency, and SSL certificate health.
Impact at OLX
Adopting Uptime Kuma has helped us close a critical visibility gap in monitoring. While we already had robust observability in place through tools like Prometheus and Grafana, these were more geared towards system metrics and performance analytics. What we lacked was a simple, dedicated way to track service uptime and health at an application level.
Since rolling out Uptime-Kuma, our teams have gained clear visibility into internal service health. Some key benefits:
- 🔔 Real-Time Alerts → We now receive instant notifications on Slack whenever a service experiences downtime or latency spikes. This has reduced our mean-time-to-detect (MTTD) significantly.
- 📊 Dashboards → Teams can visualize uptime and latency trends for APIs, worker processes, and internal services in one place. This improves transparency and helps us track SLA adherence.
- 🔐 SSL/TLS Monitoring → Expired certificates used to be a potential risk. With Kuma, certificate expiry alerts ensure we stay ahead of renewals and avoid production incidents.
- ✅ Proactive Response → Teams now identify issues before they affect customer-facing services.
- 💰 Cost-Effective & Lightweight
Unlike SaaS alternatives, Kuma is self-hosted and runs easily on Docker, making it a cost-efficient solution without vendor lock-in.
This shift has made our engineering teams more proactive, reliable, and aligned.It provides engineers with quick visibility and actionable insights, ultimately improving reliability for our users.
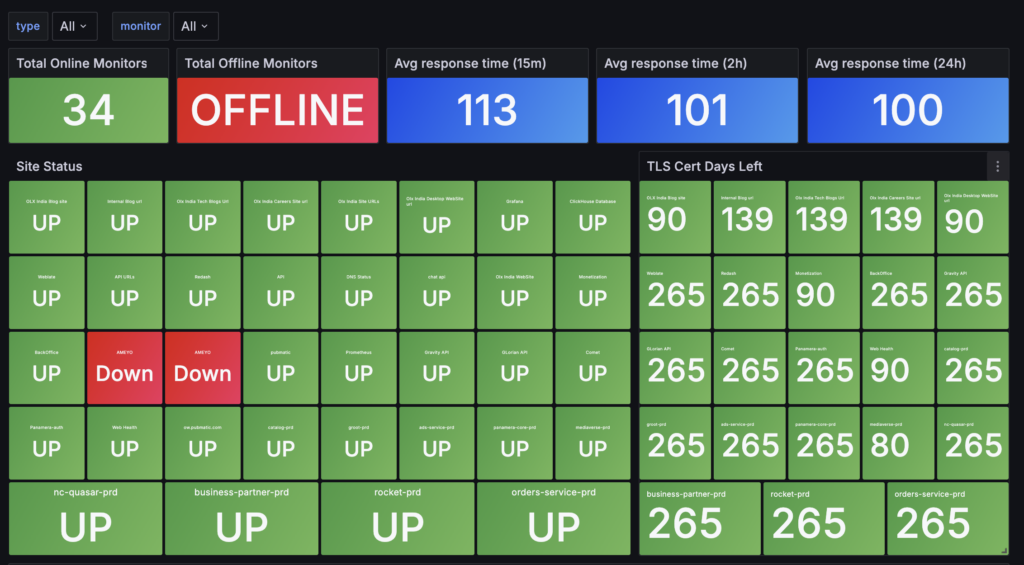
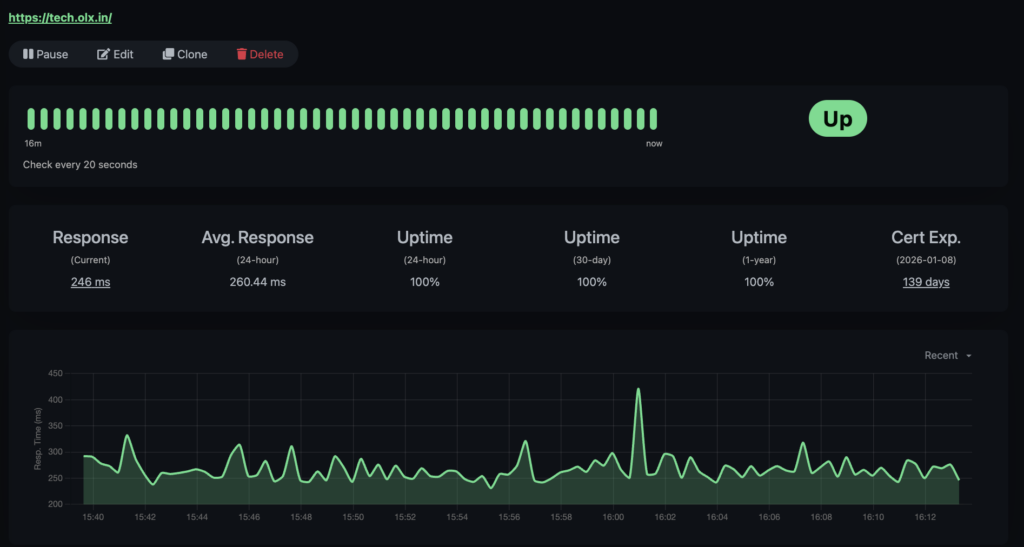
Statistics
In the overview, We can now see the availability and response times of the monitored website. Here, for example, for this Tech blog:
Conclusion 🎉
Monitoring doesn’t always need to be complex or expensive. With Uptime-Kuma, we found a lightweight, open-source solution that gives us exactly what we need — internal service uptime visibility with zero overhead.
As we continue to refine our observability stack, Kuma plays a crucial role in ensuring that our internal services remain reliable, resilient, and transparent.
✨ At OLX, we believe that clarity in operations is the first step toward reliability. Uptime Kuma helps us keep that clarity alive.
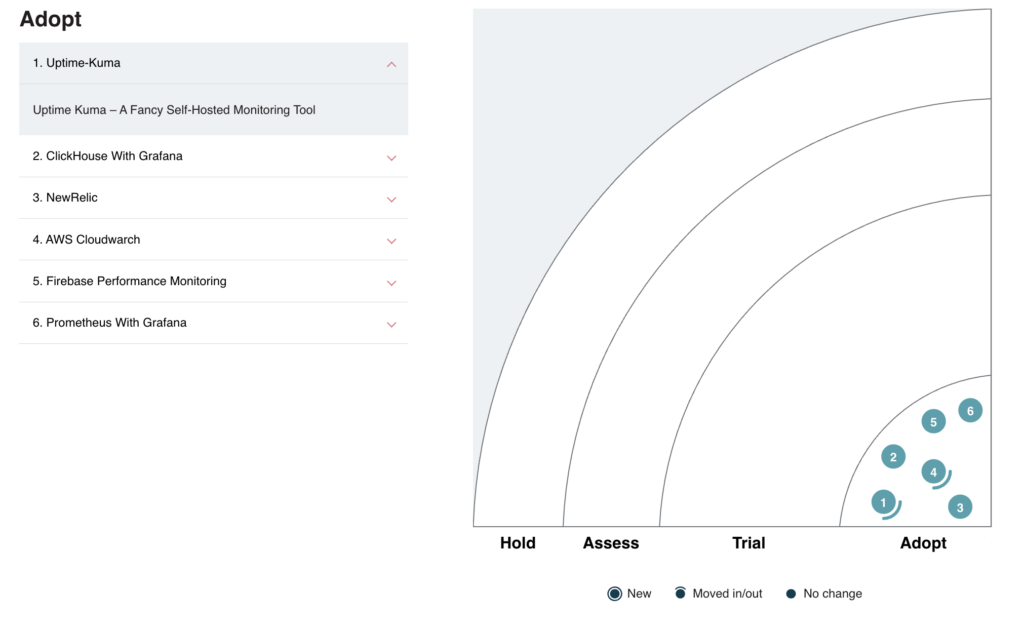
Uptime-kuma has been advanced to the Adopt ring in our OLX India Tech Radar column
Credits & Acknowledgments
Thanks to our DevOps Team for driving the evaluation, testing, and adoption of Uptime Kuma at OLX India.
Thanks for reading the blog. Please share your feedback on the tool in case you have worked with Uptime-kuma on your projects.