At OLX India, our services generate huge volumes of logs that are essential for developers, particularly when debugging or addressing incidents. Historically, we’ve utilized a mix of both open-source and licensed tools, including ELK, NewRelic, and CloudWatch, to manage and analyze these logs. However, over time, we encountered several challenges with these tools that hindered our ability to scale and maintain cost-efficiency.
[TL;DR:] In this article, we’ll share our journey of migrating to ClickHouse for logging, highlighting the benefits and lessons learned along the way.
The Importance of Logging
Logging plays a crucial role in modern systems by aiding in the investigation of incidents, helping teams trace root causes, and improving overall system resilience. It provides visibility into the state of distributed systems, making it easier to monitor performance, detect anomalies, and ensure smooth operations. Moreover, logging is vital for auditing and compliance, offering a detailed record of system events that can be referenced for security, regulatory requirements, or governance purposes. Proper logging enables teams to maintain control over complex environments and ensure accountability.
Challenges with Licensed Solutions
Third-party licensed solutions often come with several challenges. Expensive licensing costs can significantly increase the overall budget, especially as the scale of operations grows. Additionally, high data ingestion and transfer costs compound the expenses, making it difficult to manage large volumes of data efficiently. Vendor lock-in is another major concern, as it limits flexibility and forces organizations to rely heavily on a specific provider, which can hinder innovation and adaptation to new technologies. Together, these challenges drive companies to explore more cost-effective, flexible, and scalable alternatives.
- Expensive Licensing Cost
- High Data Ingestion Cost
- High Data Transfer Cost
- Long Vendor Lock-In Periods
Challenges with Traditional Open-Source Logging Tools
Tools like the ELK Stack (Elasticsearch, Logstash, Kibana) have long been popular for log management and analysis. However, they have several challenges, especially when handling large-scale data volumes.
Key Challenges:
- High operational costs: ELK requires substantial resources for storage, processing, and maintenance, leading to escalating costs as data grows.
- Scaling difficulties: As the volume of logs increases, scaling ELK becomes complex and resource-intensive, often requiring significant infrastructure investment.
- Performance bottlenecks: With larger datasets, Elasticsearch can suffer from query performance issues, leading to slow search times and delayed incident resolution.
- Data retention trade-offs: To control costs and maintain performance, teams often have to limit data retention periods, which can hinder long-term analysis and auditing.
- Complexity in setup and management: Deploying and managing ELK at scale involves a high degree of complexity, with each component (Elasticsearch, Logstash, Kibana) requiring fine-tuning and expertise.
- Fragmentation of data sources: Integrating logs from various services and environments can be cumbersome, especially when dealing with different formats or protocols.
Migration ClickHouse & Grafana
Given the challenges associated with licensed platforms and traditional open-source solutions, we decided to explore an alternative platform that could better meet our needs. Our goal was to find a solution that offers greater efficiency and cost-effectiveness for log management at OLX India.
ClickHouse is an open-source, column-oriented database management system (DBMS) designed for online analytical processing (OLAP). It enables users to generate real-time analytical reports using SQL queries. ClickHouse is renowned for its impressive performance and efficiency, offering:
- Blazing fast speed: Optimized for rapid query execution and data processing.
- Linear scalability: Grows seamlessly with increasing data volumes.
- Hardware efficiency: Utilizes resources effectively, minimizing hardware costs.
- Fault tolerance: Built to handle failures without compromising data integrity.
- Feature richness: Provides a robust set of features for comprehensive data analysis.
- High reliability: Ensures consistent performance and uptime.
- Simplicity and usability: Designed to be user-friendly and straightforward to manage.
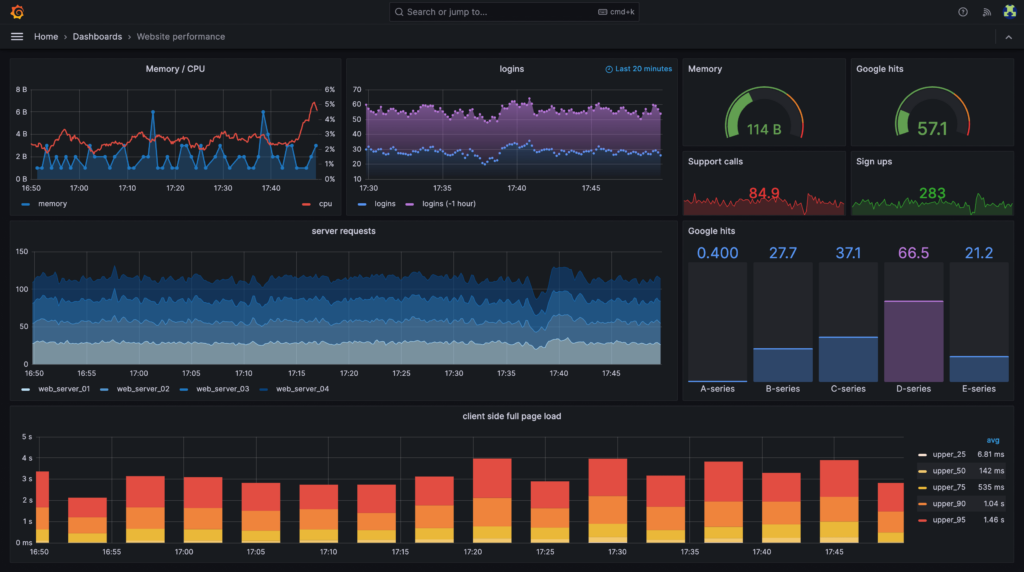
Grafana is a versatile, open-source analytics and interactive visualization platform. Through a web interface, it allows users to create and display tables, charts, and graphs and set up alerts. When connected to supported data sources, Grafana provides powerful visualizations and insights, making it an essential tool for monitoring and analyzing data across various systems.
ClickHouse & Grafana Cloud Agnosticism
ClickHouse and Grafana offer robust cloud agnosticism, allowing for deployment on any cloud provider or on-premises. This flexibility enables you to choose the best cloud provider based on cost and performance needs. Additionally, their interoperability ensures seamless integration with various cloud services, supporting both hybrid and multi-cloud environments.
Why ClickHouse is an Excellent Fit For Logging
ClickHouse, a column-oriented DBMS, excels at handling OLAP workloads, which aligns closely with the characteristics of logging workloads. Both workloads are read-heavy, involve large batches of inserts with infrequent updates, and primarily deal with immutable data. These similarities make ClickHouse particularly well-suited for efficiently managing and querying large volumes of log data.

ClickHouse Compression Codecs
ClickHouse provides excellent compression codecs at the block level, including LZ4, Brotli, and ZSTD. These codecs effectively reduce the amount of data that needs to be read from disk, thereby enhancing performance. Additionally, ClickHouse utilizes dictionary compression, which is particularly useful for columns with low cardinality. This method replaces repeated values with smaller integers, known as dictionary indices, further optimizing data storage and retrieval.
Scalability with ClickHouse
- Clickhouse is relatively easy to scale and comes bundled with clickhouse-keeper, which makes it possible to set up a distributed Clickhouse cluster with multiple nodes replicating data with each other.
- Clickhouse-keeper is a drop-in replacement for ZooKeeper written in C++, with a fully compatible client protocol and the same data model, and multiple improvements over traditional zookeeper.

Logging pipeline
- Vector: For shipping logs to central storage.
- Clickhouse: Storage layer for all the logs.
- Grafana: Query/UI layer for visualizing/performing queries.

Vector is an ultra-fast log shipping agent that has a low resource overhead. Designed to collect logs from various sources, Vector can perform numerous transformations on the collected logs and send them to multiple sinks.
Vector Aggregator – Incoming logs are first stored in a disk buffer by Vector before being forwarded to an upstream sink. Since logs are organized into separate tables for each service, we utilize a routing key specified by the Vector agent to direct them accordingly. Based on this key, Vector’s route transformer sends the logs to the appropriate ClickHouse table. Vector employs a domain-specific language called VRL (Vector Remap Language) for log transformations, which offers robust capabilities. We use VRL to perform various modifications to the original log events, including:
- Parsing raw logs into JSON or other formats
- Adding or modifying fields within the logs
- Filtering out irrelevant logs
- Enriching logs with additional metadata
ClickHouse serves as the storage layer, handling the ingestion and management of all log data due to its high-performance, column-oriented architecture.
Grafana acts as the query and user interface layer, providing powerful visualization and query capabilities to analyze and interpret the stored logs. Together, these components create a robust and scalable logging solution, from log collection through to visualization and analysis.
Cost Efficiency
- Storage Optimization: ClickHouse’s columnar storage reduces disk usage, significantly lowering storage costs along with its excellent compression Codecs. [Detailed Comparision Below]
- Query Performance: Efficient data retrieval with minimized computational overhead. [Detailed Comparision Below]
- Open Source: No licensing fees, reducing overall costs.
- Cloud Agnostic Deployment
- ClickHouse supports distributed processing and horizontal scaling, which allows organizations to only add resources as needed. This prevents over-provisioning, which is often a concern in cloud setups.
ClickHouse’s Columnar Storage
A columnar database stores the data of each column independently. This allows reading data from disk only for those columns that are used in any given query. The cost is that operations that affect whole rows become proportionally more expensive. The synonym for a columnar database is a column-oriented database management system. ClickHouse is a typical example of such a system.
Key columnar database advantages are:
- Queries that use only a few columns out of many.
- Aggregating queries against large volumes of data.
- Column-wise data compression.
For reference – Explaining Columnar Databases
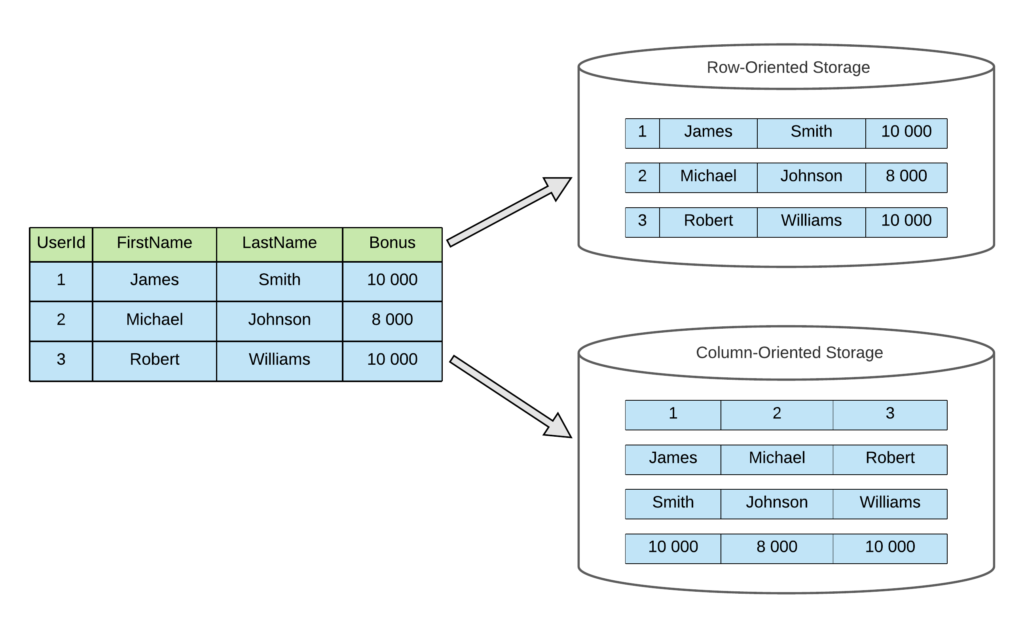
Source – https://vkontech.com/
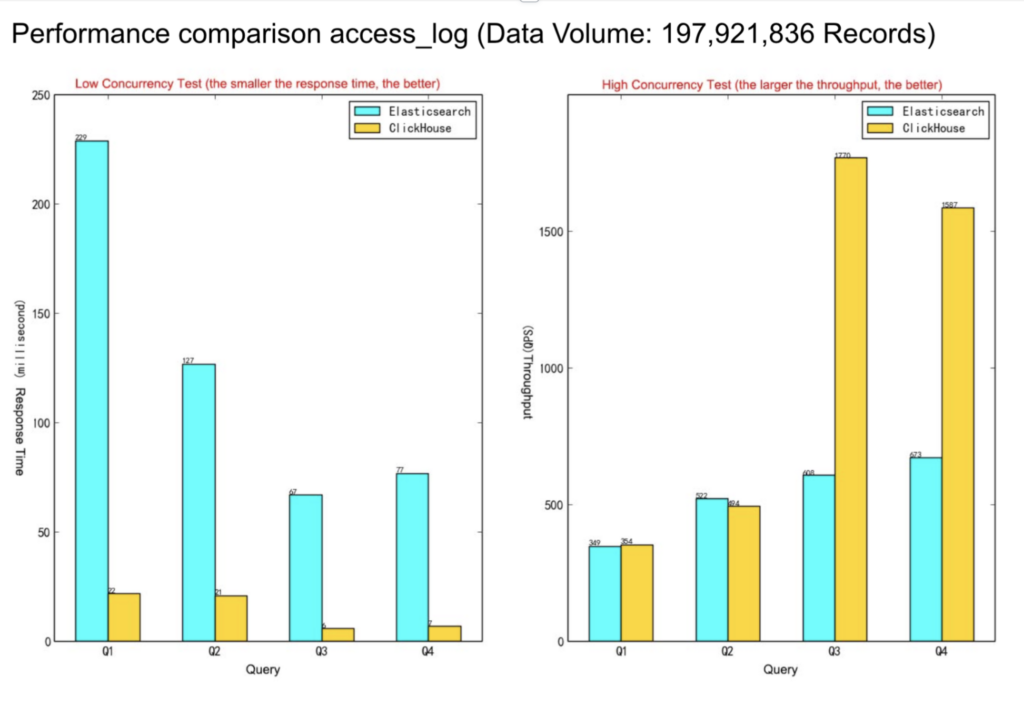
Performance Comparison with ELK
Elasticsearch excels in search scenarios with limited record filtering and performs well with sufficient memory resources, providing strong concurrent query capabilities. However, for large-scale data analysis where many records are filtered, ClickHouse offers better performance due to its columnar storage and vectorized computing. ClickHouse supports a wider range of query types and leverages disk throughput for concurrency, making it more cost-effective for large data volumes. In contrast, Elasticsearch relies on memory cache, which can lead to higher costs. Overall, ClickHouse is more suitable for cost-effective analysis of large datasets due to its efficient use of disk bandwidth and lower import and storage costs.
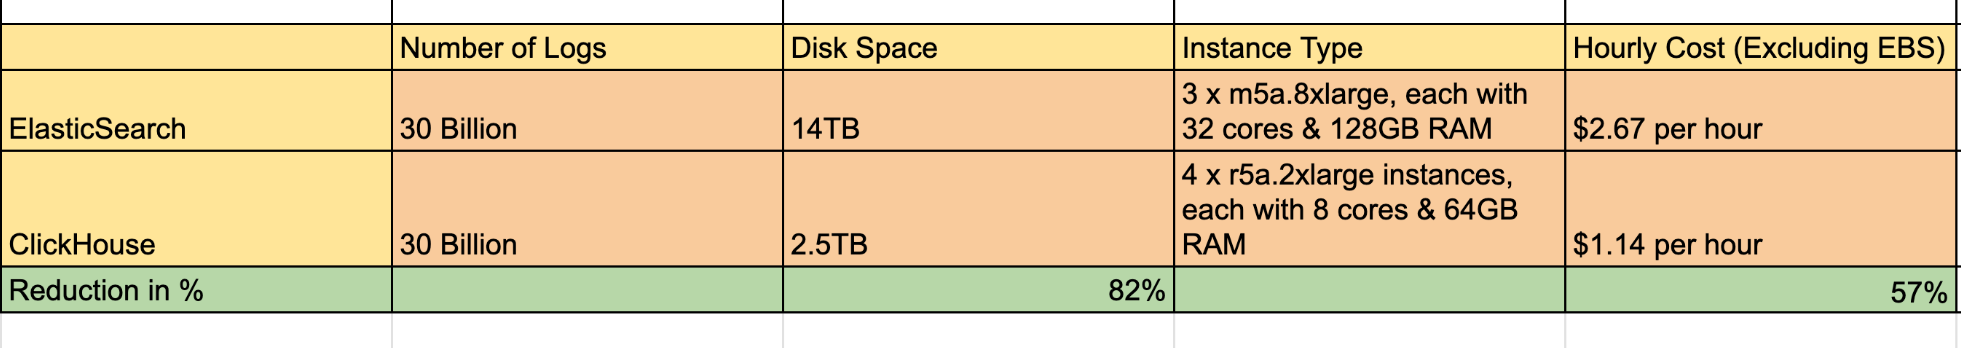
Storage and Server Cost Comparison with ElasticSearch
ClickHouse provides excellent cost reduction in required disk space and server cost as shown below – It provides over 80% save in disk space due to its excellent compression codecs and columnar storage design and also provides over 50% save in overall instance running costs in comparison to Elastic Search.
Simplified Setup Guide to Get Started
Step 1 – Installing ClickHouse and Grafana
We installed it using Helm Charts to deploy it on our Kubernetes Clusters, you can use docker image, Helm or any other package manager to install ClickHouse and Garfana.
“Bitnami charts for Helm are carefully engineered, and actively maintained and are the quickest and easiest way to deploy containers on a Kubernetes cluster that are ready to handle production workloads.”
Reference – ClickHouse Installation Guide Grafana Installation Guide
Step 2 – Install Vector to Ship Server Logs to ClickHouse Database.
We can install vector agent using docker image or any package manager like Helm.
https://vector.dev/docs/setup/installation
Step 3 – Configure Vector
Configure Vector, Sources and Sinks & Configure Data Transformations.
Sample snippet of our Vector Agent config –
role: "Agent"
customConfig:
  data_dir: /vector-data-dir
  api:
    enabled: true
    address: 127.0.0.1:8686
    playground: false
  sources:
    kubernetes_logs:
      type: "file"
      include:
        - "/var/log/containers/*.log"
      exclude:
        - "/var/log/containers/vector*.log"
      read_from: "end"
  sinks:
    vector:
      inputs: ["kubernetes_logs"]
      type: "vector"
      address: "0.0.0.0:6000"
Sample snippet of our Vector Aggregator config –
role: "Aggregator"
image:
  repository: [image-path]
  tag: vector37
  pullPolicy: IfNotPresent
  pullSecrets:
    - name: vector-secrets
customConfig:
  data_dir: /vector-data-dir
  api:
    enabled: true
    address: 127.0.0.1:8686
    playground: false
  sources:
    vector:
      address: 0.0.0.0:6000
      type: vector
      version: "2"
  transforms:
    dots_to_underscores:
      type: remap
      inputs: [vector]
      source: |
        .kubernetes_pod_name = .kubernetes.pod_name
        .kubernetes_pod_namespace = .kubernetes.pod_namespace
        .kubernetes_pod_appname = .kubernetes.pod_labels.app
        _timestamp = .timestamp
        del(.kubernetes)
        if exists(.message) && is_string(.message) {
        .parsed_message, err = parse_json(.message)
        if is_object(.parsed_message) && exists(.parsed_message."trace-id") {
        .traceId = .parsed_message."trace-id"}}
  sinks:
    clickhouse:
      type: clickhouse
      inputs: [dots_to_underscores]
      database: [DataBaseName]
      endpoint:  'http://clickhousedb.endpoint'
      auth:
        strategy: "basic"
        user: "username"
        password: "password"
      table: logs_dist
      compression: gzip
      date_time_best_effort: true
      batch:
        timeout_secs: 10
        max_events: 10000
        max_bytes: 10485760
      skip_unknown_fields: true
Step 4 – Define Logs Table Schema in the ClickHouse Database.
Designing a proper schema is a crucial step in ensuring optimal query performance in ClickHouse.

Step 5 – Define Indexing, TTL, Sort Key & Data Partitioning Keys
You can define custom indexing if you need it, along with TTL and Data Partitioning keys.
Clickhouse organizes data into multiple partitions, each defined by a partition key. For applications with low log volume or a short time-to-live (TTL), partitioning data into monthly blocks is often sufficient. However, if query patterns focus on finding data within a few days rather than months, it’s better to split partitions into daily blocks.
Besides indexing, and partition keys, another critical factor determining query performance is specifying the order of columns in the ORDER BY clause when creating the table. The query will execute faster if the columns in the ORDER BY clause are ordered based on the ascending order of their cardinality.
Step 6 – Create a Logging Dashboard on Grafana
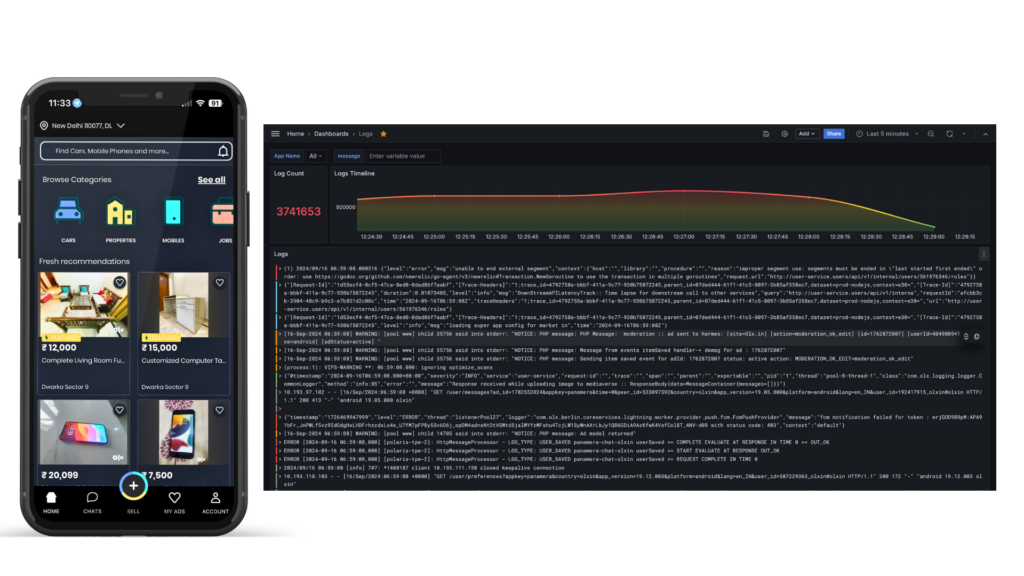
You can easily create a logging dashboard on Grafana, We have created a very simple logging dashboard for our general query needs as shown below in the screenshot.

We have added five items in the dashboard, one drop-down to select the application name, and one text box for adding query messages to filter out logs based on log messages. One widget for total log count, one graph for log count time series visualisation and a final logging table where matched logs get listed out for analysis.
Step 8 – Query your Logs
You are done, you can query your logs from your dashboard now.
Conclusion
- ClickHouse & Grafana offer a performant, cost-effective, cloud-agnostic alternative to traditional logging tools like the ELK Stack.
- Superior performance and flexibility, especially in cloud-native and large-scale environments.
- Community Support is also increasing as many big companies like OLX are using it in production and contributing back to it.
We have moved ClickHouse with Grafana to Adopt ring from Trial in our OLX Tech Radar Column

Acknowledgements
Development Contributions For Logging Pipeline Setup – Pushpender Kumar and Parvez Hassan