As India’s leading classified platform, OLX India deals with a massive volume of transactions, interactions, and data daily. To keep up with user demands and ensure top-notch service, it’s crucial to have real-time insights into our system’s performance.
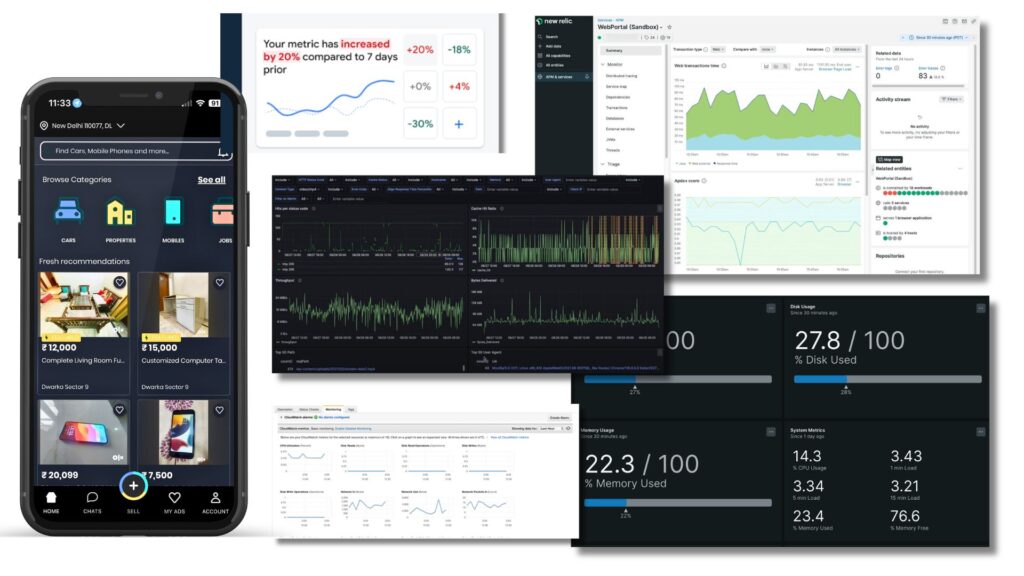
Observability and monitoring are crucial for maintaining a robust and efficient system. Monitoring provides real-time alerts and performance metrics, helping to identify and address issues before they escalate quickly. Observability goes deeper, offering insights into the internal workings and interactions within the system, making it easier to understand the root causes of problems. Together, they enhance troubleshooting, improve system performance, reduce downtime, and support better decision-making, ensuring a smoother and more reliable operation.
[TL;DR:] In this article, Let’s dive into how the OLX India Technology team leverages Observability and Monitoring.
Understanding Monitoring and Observability
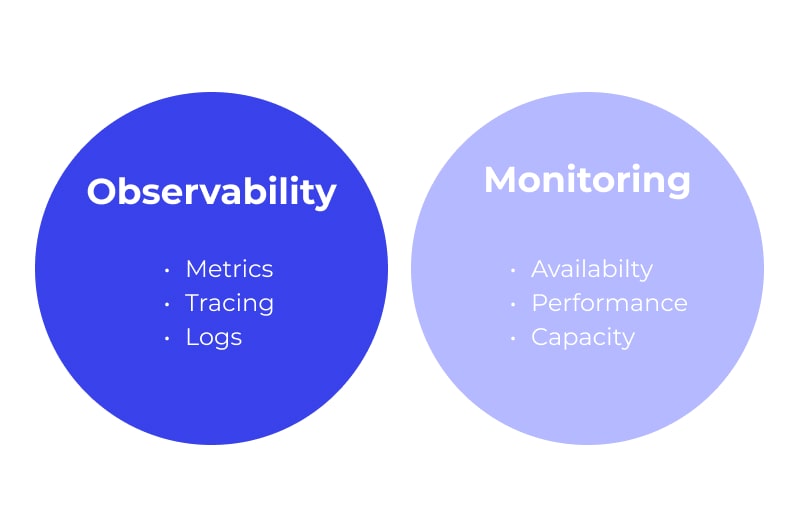
Monitoring
Monitoring is like keeping an eye on the important signs of a system’s health, just like a doctor might monitor a patient’s vital signs. In the context of cloud technology, monitoring is about tracking key indicators of a system’s performance, like memory, performance, errors etc. Monitoring tools help you add alerts on these metrics, with which you can keep a constant watch on a system to make sure it’s healthy and functioning as expected.
Observability
Observability is like being able to look inside a system and understand what’s going on, even if you can’t see it directly. Imagine you’re watching a car drive by; you can’t see the engine, but you can observe things like the car’s speed, the sound it’s making, and how much smoke is coming out of the exhaust. Based on these observations, you can understand if the car is running smoothly or if there might be a problem.
In cloud technology, observability means using various tools and methods to understand what’s happening inside a complex system. By looking at different types of data and signals that the system gives off, like logs, traces or metrics, we can understand the internal workings of something that otherwise can’t be seen directly.
Importance of Monitoring & Observability
- Proactive Issue Detection: Quickly spot and address issues before they impact users.
- Comprehensive Performance Insights: Understand both surface-level metrics and the deeper causes behind them.
- Enhanced Troubleshooting and Debugging: Monitoring highlights when and where issues arise, while observability allows for detailed root cause analysis by examining the complete flow of data and system behaviour, facilitating quicker and more accurate debugging.
- Enhanced Alerting and Analysis: Monitoring alerts you to immediate problems, and observability enriches these alerts with context, helping to understand the broader impact and underlying causes of issues.
- Reduced Downtime – With monitoring-based alerts and observability, we can quickly address issues and bugs to reduce overall downtime in our platform.
- Real-Time and Historical Analysis: Analyze current and past data to spot trends and predict future issues.
- Informed Decision Making: Use detailed data and context to make better decisions for system improvements.
- Enhanced System Reliability: Improve overall system stability and reliability by continuously monitoring and understanding system behaviour with Observability.
- End-to-End Visibility and Context: Observability complements monitoring by providing a full view of how requests move through a distributed system, identifying bottlenecks and complex interactions that monitoring alone might miss.
What tools are we using at OLX India for Monitoring & Observability?
- NewRelic
- At OLX India we are currently using NewRelic an All-in-one Observability Platform for Backend & PWA.
- We also use NewRelic for Infrastructure Monitoring mainly for container cluster health monitoring and Application Logging.
- Akamai TrafficPeak Observability Platform
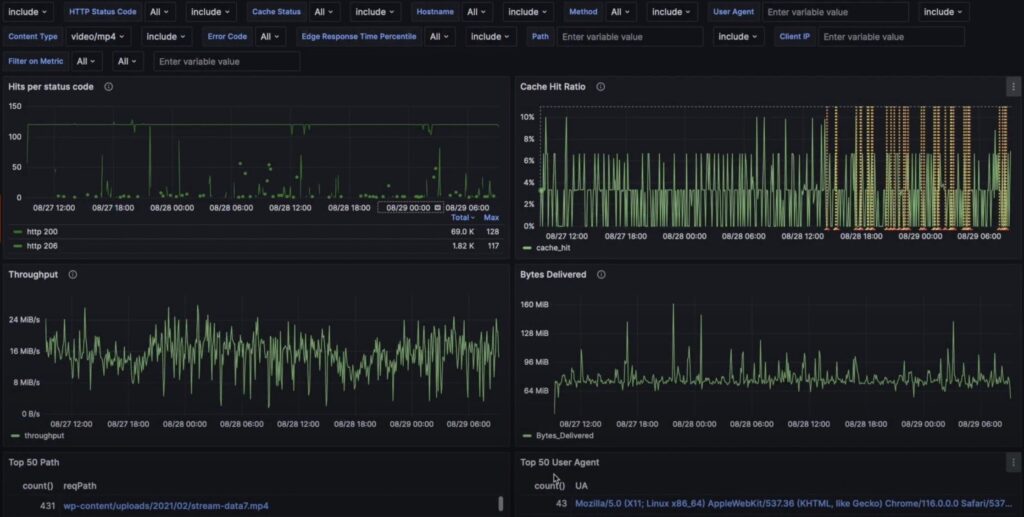
- We are using Akamai TrafficPeak Observability Platform for real-time monitoring of traffic reaching our Edge Networks. TrafficPeak delivers real-time data visualization and long-term data retention.
- With TrafficPeak, we can gain critical insights into their applications, users, and infrastructure with simple queries, customizable dashboards (based on Grafana), subsecond query performance, and customizable scheduling of automatic data retention.
- AWS CloudWatch
- For broader Infrastructure monitoring, we are using AWS Cloudwatch, which provides us visibility across different metrics of our infrastructure be it Databases, EC2 Machines, Lambdas, Queues etc.
- Firebase
- For the Mobile Applications, we are using Firebase, which offers a suite of tools that enhance our observability and performance monitoring capabilities for mobile applications
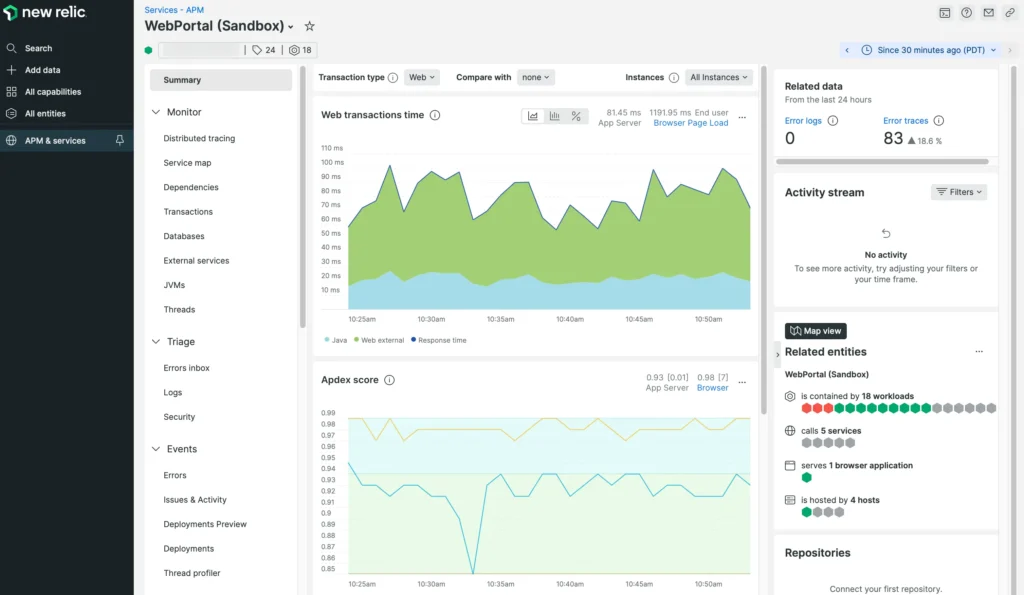
What does NewRelic Offer?
- Unified Observability: New Relic offers a single platform that integrates metrics, logs, and traces. This unified approach allows us to gain a holistic view of our application’s health and performance, simplifying the troubleshooting process.
- Real-Time Analytics: With New Relic, we can monitor our applications and infrastructure in real-time. This immediacy enables us to detect anomalies, pinpoint issues, and respond swiftly, ensuring minimal user disruption.
- Infrastructure Monitoring: infrastructure monitoring to keep tabs on our servers, databases, and other critical components
- Customizable Dashboards: The ability to create and customize dashboards tailored to our specific needs allows us to focus on the most critical metrics and KPIs.
- Alerts and Notifications: New Relic’s alerting capabilities are crucial for proactive monitoring.
- Scalability: New Relic’s scalable architecture aligns with our growth strategy. As OLX India continues to expand and our platform evolves, New Relic’s flexible solutions scale with us, accommodating increasing data volumes and complexity.
- Browser Events: New Relic’s browser monitoring capabilities provide insights into the performance of our web applications from the end-user’s perspective.
- Other Useful Features – Session Replays, Deployment Trackers, Service HeatMaps, Mobile Monitoring, Synthetic Monitoring.
What does the Akamai Observability Platform Offer?
- Ingest, Monitor, Query: TrafficPeak is a fully managed observability platform that enables you to ingest, monitor, query, store, and analyze Akamai logs in real-time.
- Dashboarding: We can create custom dashboards and monitor different application parts from the end of Edge Networks. Where we can monitor/observe things like – Cache Hit Ratios, Edge turn-around time, throughput, bytes-delivered request IPs & user agents.
Reference – Linkedin: How to gain observability from your Akamai
Source – Linkedin: How to gain observability from your Akamai
What does Firebase Offer? (In reference to Monitoring & observability)?
- Crashlytics: Firebase Crashlytics provides real-time crash reporting for our mobile apps. It helps us understand the stability of our applications by highlighting the frequency and impact of crashes and offering detailed insights into the root causes.
- Performance Monitoring: Firebase Performance Monitoring offers in-depth insights into app performance, including app startup times, network latency, and screen rendering times. This allows us to identify and address performance bottlenecks, enhancing the user experience.
- Analytics: Firebase Analytics provides comprehensive data on user interactions and behaviours within our apps. This data helps us make informed decisions on feature improvements and understand user engagement patterns.
- Alerts and Notifications: Firebase also supports real-time alerts for critical issues, such as app crashes and performance degradation.
What does AWS CloudWatch Offer?
- Metrics: CloudWatch collects and tracks metrics, which are variables you can measure for your resources and applications.
- Logs: It monitors, stores, and accesses log files from Amazon EC2 instances, AWS CloudTrail, and other sources.
- Alarms: CloudWatch Alarms send notifications or automatically make changes to the resources you are monitoring based on predefined rules.
- Events: CloudWatch Events delivers a near real-time stream of system events that describe changes in AWS resources.
- Dashboards: Customizable home pages in the CloudWatch console provide an at-a-glance view of your cloud environment.

Let’s dive into Implementation –
1. Stack Instrumentation
- The first step in our implementation was to instrument our tech stack with New Relic’s agents or Open Telemetry Agents (Using OTEL provides you with the benefit of ease of switching between different observability Platforms, keeping your instrumentation logic separated from platform-based dependencies).
- Akamai Traffic Peak Platform is configured with streaming data from the Akamai Control Center to the TrafficPeak infrastructure build.
- For mobile applications integrate Firebase monitoring SDKs in your Android and iOS code base.

2. Setting Up Alerts
Setting the right set of Alerts across applications is the most important thing for a technology platform.
As the great Murphy’s law states “Anything that can go wrong will go wrong”, which holds very true for technology platforms. And proactively identifying those potential issues which can cause bad user experience for your customer is very crucial and alerts can help you achieve that.
Having two types of alerting is good for any application –
- High-Level Alerts – Alerts on standard application level metrics throughput levels, response time, error rate etc.
- Low-Level Alerts – Along with the alerts on standard application monitoring metrics, we should also define custom alerts based on domain and system transactions. Which makes sure that all funnels of your business are running as expected without any issues. Along with adding alerts on infrastructure metrics as well for example – Database Health, dead latter queues, lambda failures etc.


(Use terraform code for setting up the alerts, as part of general Infrastructure as code (IaC) practice.)
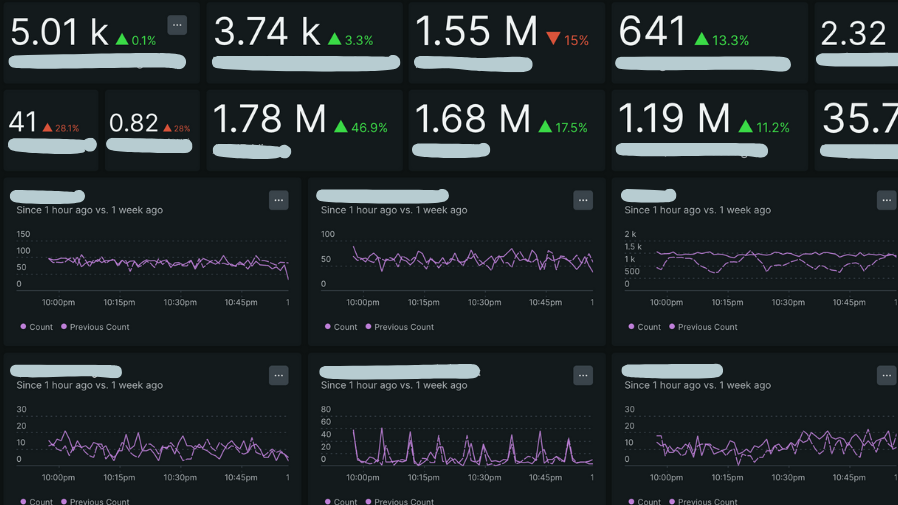
3. Setting up Dashboard –
Teams should create an application and domain-specific dashboard which can provide them with one-place visibility of their applications based on which we can identify issues and proactively plan for improvements and identify issues.
4. Analyzing and Optimizing Performance
Metrics, Traces & Logs enable us to perform root cause analysis of performance issues. By examining detailed transaction traces and transaction breakdowns, we can identify bottlenecks and areas for optimization. This analysis is instrumental in enhancing the efficiency and reliability of our platform.
5. Leveraging Logs and Traces
Logs and distributed traces provide valuable context to performance data. We leverage New Relic’s log management and Firebase to aggregate and analyze log data from various sources. Distributed tracing helps us track requests as they traverse different services, making it easier to identify performance bottlenecks and optimize our service interactions.
Make use of Spans and traces for better tracing across distributed systems. In distributed tracing, a trace is a view of a request as it moves through a distributed system. A span is a named, timed operation that represents a part of the workflow. Multiple spans are pieced together to create a trace.

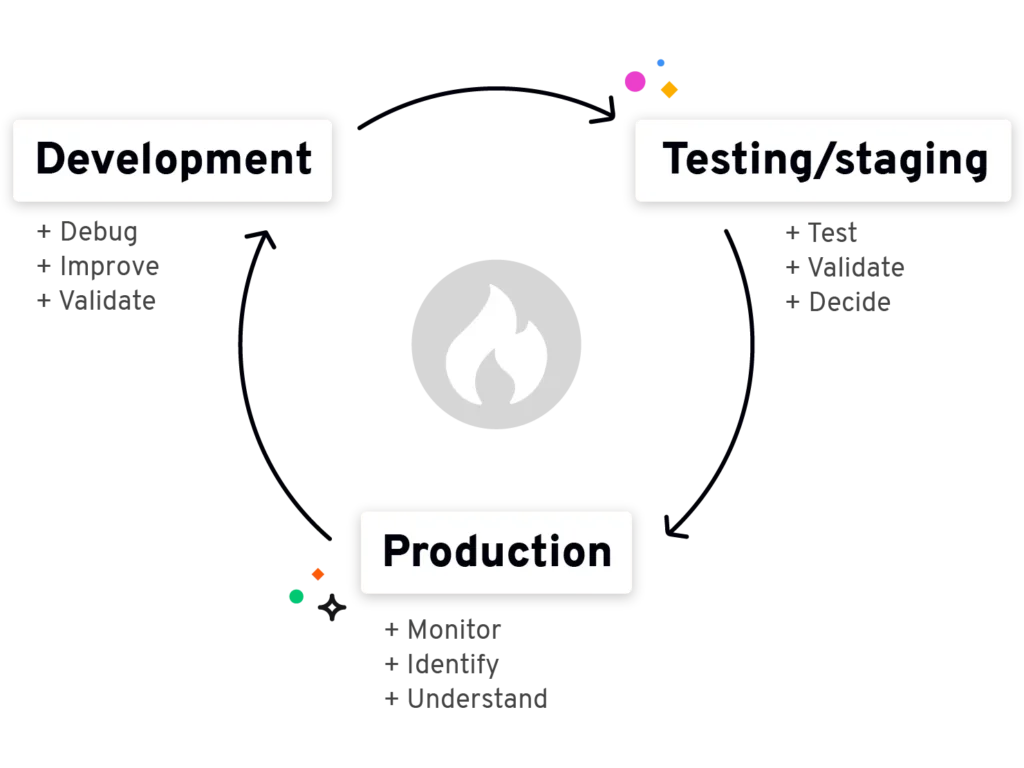
Observability-Driven Improvement
At OLX India, we are trying to aim for Observability-Driven Improvement, where Monitoring & Observability play a crucial part in continuous application improvement.
Observability-Driven Improvement is a non existent term, which is coined by none other than the author of this article. Teams can use Observability data to improve their solutions for better performance, reliability and availaibilty.
– Parvez Hassan
Conclusion –
These were some high-level insights on how OLX India is implementing monitoring and observability. There are a lot more things and a lot more low-level details that we will try to cover in another blog.
In today’s tech-driven world, robust monitoring and observability are critical for any tech company aiming to stay competitive. As systems grow in complexity and user expectations rise, the ability to quickly detect and diagnose issues is vital. For companies committed to delivering seamless digital experiences, investing in these practices is essential to ensuring system reliability, customer satisfaction, and long-term success.
